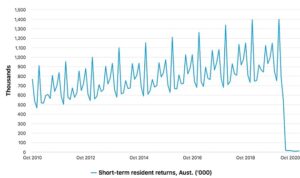
 When it comes to travel and tourism, it’s no secret that 2020 has been a stinker of a year – yet the latest tourism graphs still come as a surprise, eerily reminiscent of a hospital ECG monitoring a critical patient’s pulse rate.
The latest graphs, newly released by the Australian Bureau of Statistics, cover the 10 years to October 2020. They show the number of inbound visitors to Australia climbing steadily, peaking at over a million in the month of December 2019. The graph clearly shows regular annual pulses – the holiday-season peak in December, with rhythmic fluctuations each year falling to the winter travel trough in May-June.
Then, from December 2019 onward, the line on the graph plunges. Covid-19 has struck! By April 2020, the line has tanked, reaching near zero. From then on, the graph flatlines. In medical terms, the patient is dead.
In tourism terms, however, the patient is on life support and about to recover. This will begin as soon as the travel bubble opens up with New Zealand (Gates open! Two-way travel bubble with NZ from early 2021). The recovery should then spread with the rollout of Covid-19 vaccines.
The graph for short-term resident returns (a way of measuring overseas travel from Australia) is very similar over the same 10-year period: a series of rhythmic pulses, then a sudden plunge to flatline. But don’t fret – the prognosis is not fatal!
For the record, in October 2020, a total of 6070 visitors arrived in Australia on short-term visits. This was a decrease of 99.2% when compared to the corresponding month of the previous year. New Zealand was the largest source country, accounting for 15% of all visitor arrivals.
Below: Short-term resident returns to Australia in the 10 years to October 2020. Source: Australian Bureau of Statistics

In the other direction, a total of 11,170 short-term trips were recorded in October 2020 by residents returning from overseas. This was a decrease of 99% when compared to the corresponding month of the previous year. New Zealand was the most popular destination country, accounting for 15% of all resident returns.
Below: Short-term visitor arrivals in Australia in the 10 years to October 2020. Source: Australian Bureau of Statistics

The graphs are better when you look at them online, where they are interactive and show a running total as you follow them. For that, see the ABS site here.
Written by Peter Needham


